Sales Details
- Time Period Selection: The widget allows users to specify the time period for which they want to analyze the sales details and order totals. Users can choose a predefined range (e.g., last 7 days, current month) or customize the time period according to their specific requirements.
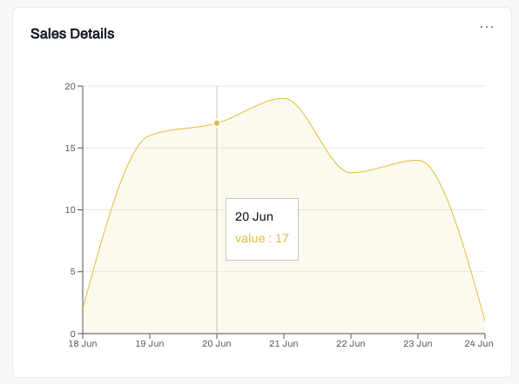
- Order Totals Data: The widget fetches the order totals data for the selected time period and presents it in a point-to-point graph. Each point represents the order total at a specific date or time, while the X-axis represents the timeline.
- Interactive Features: Users can interact with the graph by hovering over or clicking on individual data points. This action displays the order total and specific date at the point in the graph they are on.
- Trend Analysis: The point-to-point graph can visually depict sales trends and patterns over time. Users can observe upward or downward trends, identify seasonal variations, or detect any significant changes in order totals.
- Time Granularity Options: The widget offers options for users to select the desired time granularity for the graph. For example, they can view order totals on a daily, weekly, or monthly basis, depending on the level of detail required for analysis.