Product Summary
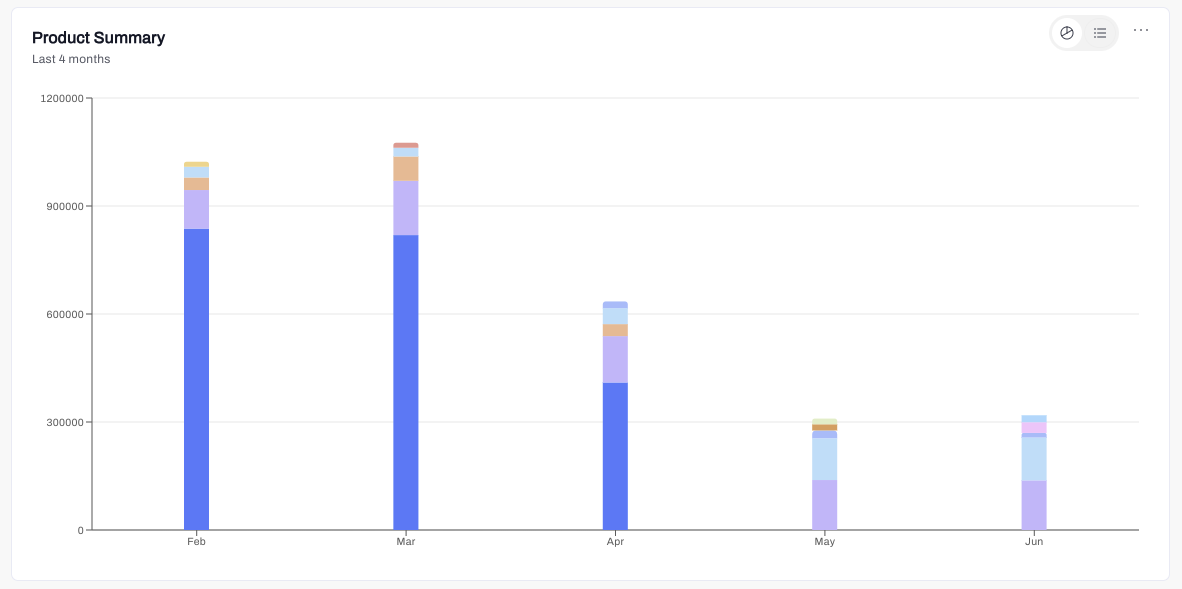
- Bar Graph Representation: The bar graph visually represents important metrics or attributes of the fuel products. Each product is represented by a vertical bar, with the height of the bar indicating the value of the respective metric.
- Color Coding: The bars in the graph are color-coded to highlight different fuel types.
- Interactive Features: Users can interact with the bar graph by hovering over or clicking on individual bars. This action displays detailed product information about the data in that bar.
- Filtering: The widget includes filtering options to customize the dates displayed on the bar graph. Users can apply filters to view specific subsets of products (e.g., gasoline only, products within a certain date range).
- Dynamic Updates: The bar graph and the underlying data updates dynamically as new products are added and new orders are placed. This ensures that users have the most up-to-date information and visual representation of the fuel products.
- Product Listing: The widget has an option to display the product summary in list view showing a percentage breakdown of the products that have been ordered in the selected time period.